
Logs contain information about errors or issues with nodes or software. You can look for errors in a variety of systems:
- kernel modules that failed to load
- network drivers or modules that fail to load
- failed filesystem mounts
In addition to failures, logs contain warnings, which can alert you about a system that, although it can appear to be working correctly, might have subtle issues or poor performance. (Remember, you want high-performance computing, not meh-performance computing.) Logs contain information about successful logins, failed logins, and any root access or use of sudo, which allows you to look for anything unexpected or abnormal.
Beyond errors and warnings, looking for abnormal behavior is a primary goal of examining logs. Although written in 1989, The Cuckoo's Egg by Clifford Stoll offers a glimpse of how abnormal behavior or “gaps” in logs can lead to the discovery of compromised systems. The book is not necessarily a warning for high-performance computing (HPC) administrators, but rather a reinforcement of good administrative behavior.
The goal is to analyze the logs of your HPC systems to look for problems or performance issues. Log analysis comprises a few steps:
- data collection into a log
- log/data conversion/formatting
- log search/analysis
- visualization
In this article, I only focus on the first step, log collection. The next article will discuss the next steps.
Linux Logs
Linux stores information about various aspects of the system in a set of text-based logs that contain time-based information for the operating system, applications, various systems, and the kernel. These logs are located in /var/log/ and are generally broken into individual files according to four categories:
- system logs
- service logs
- application logs
- event logs
A good online article lists 20 logs you might find on your system.
Some specific logs are:
syslog(system log information)kern.log(kernel logs)dmesg(daily message information for the dmesg command, which is taken from syslog)auth.log(authentication information)boot.log(boot information)
As an example, Table 1 shows some of the logs on my Xubuntu 20.04 system. This isn't every single log in /var/log, but it is a good slice of it.
alternatives.log |
fontconfig.log |
apport.log |
gpu-manager.log |
auth.logp |
gpu-manager-switch.log |
boot.log |
kern.log |
dmesg |
syslog |
dpkg.log |
Xorg.0.log |
dpkg.log |
These logs typically have a more or less standard format. For example, /var/log/syslog has a standardized header. For most logs, each line starts with a timestamp of the event (when the log entry was made), followed by the name of the host (more on this later), followed by the application name, the location in the system where the message originated, and the priority of the event.
Because current versions of the logs in /var/log are text files, they can be manipulated by all of the classic Linux tools (e.g., more, less, grep, sed, awk). Any text editor can be used, as well.
Log Rotation
When you look at the files in /var/log, you will see that many (but not all) end in .log. These are the current logs that have the most recent information. Rather than let these logs just get larger and larger, the logs are periodically “rotated.” For example, the current system log is syslog, the previous log is syslog.1, the version before that is syslog.2, and so on.
Generally, log rotation is managed by the logrotate package (Listing 1), which is installed by default on my Ubuntu 20.04 systems.
Listing 1: logrotate
$ logrotate --version
logrotate 3.14.0

    Default mail command:       /usr/bin/mail
    Default compress command:   /bin/gzip
    Default uncompress command: /bin/gunzip
    Default compress extension: .gz
    Default state file path:    /var/lib/logrotate/status
    ACL support:                yes
    SELinux support:            yes
The logrotate tool can deliver logs by email and can compress and uncompress the logs (with gzip and gunzip). It also tells you where you can find the “state” of log rotation (/var/lib/logrotate/status).
You can change the compress/uncompress tools to something you want (e.g., pigz, which will use all of the cores). You could even add options to change compression levels. Logs are just text files, so they can be compressed quite a bit. It’s up to you; just be sure that if you change the compression tool, you don’t remove that tool.
The logrotate configuration is controlled by the /etc/logrotate.conf configuration file. Listing 2 shows my configuration. Most of the fields are self-explanatory, but if they aren’t the defaults are a good place to start. Two key items are the rotation time (weekly) and the unit number of rotation time to retain the back logs (4 = 4 weeks).
Listing 2: logrotate Configuration
$ more logrotate.conf
# see "man logrotate" for details
# rotate log files weekly
weekly

# use the adm group by default, since this is the owning group
# of /var/log/syslog.
su root adm

# keep 4 weeks worth of backlogs
rotate 4

# create new (empty) log files after rotating old ones
create

# use date as a suffix of the rotated file
#dateext

# uncomment this if you want your log files compressed
#compress

# packages drop log rotation information into this directory
include /etc/logrotate.d

# system-specific logs may be also be configured here.
The subdirectory /etc/logrotate.d is where any installed packages that need help with log rotation put their log rotation configuration. For example, on Ubuntu, these packages include apt, dpkg, and rsyslog. For my Ubuntu 20.04 system, that directory looks like Listing 3.
Listing 3 /etc/logrotate.d
$ ls -s
total 60
4 alternatives  4 apport   4 apt  4 bootlog  4 btmp      4 cups-daemon
4 dpkg          4 lightdm  4 ppp  4 rsyslog  4 speech-dispatcher
4 ubuntu-advantage-tools   4 ufw  4 unattended-upgrades  4 wtmp
In general, you might want to copy the logs and store them somewhere else just before log rotation, or you could copy the logs and prepend a date to the name for better tracking. If a log is important to you, you might want to back it up off the system after copying it.
Centralized Logs
Every system creates logs. If you have a distributed HPC system with separate nodes, then examining the logs on each system can be difficult, especially if you have many systems. You must log in to each node, do whatever you need to do, and move on to the next node. If you have a fair number of nodes, you can see that log checking can become a pain – never mind the amount of time it would require. Moreover, if you process the logs, perhaps looking for patterns, the pain level increases.
A solution to this situation is some sort of log aggregator that combines the logs from all nodes into one log. Fortunately, several tools can do this.
Log aggregation tools focus on just gathering the logs on a centralized log system. These tools are becoming rarer because many are now combined with log analysis tools (makes sense). Personally, I like to separate the functions of log aggregation and log analysis, but to each their own.
rsyslog
In the 1980s the syslog system logging standard was released. Although it wasn’t a true standard, approved by various governing bodies, at the time, there were no competing standards. Syslog initially was described as a protocol by the Internet Engineering Task Force (IETF) in RFC3164 and thereafter as a standards track protocol in RFC5424. Although this protocol sounds somewhat dull, it was a big leap in administering Unix and Unix-like systems, with logs of the system, the events, the services, and the applications all having a common place, independent of the source of the logs. Huge deal! Moreover, syslog allowed a client-server architecture so that logs from clients can be stored in a centralized location (the server).
The rsyslog open source tool uses the syslog protocol but extends it to support different module outputs, queued operations to handle offline outputs (excellent feature), rich filtering capability, and content-based filtering. It started as open source, is still being developed, and has grown so that a company, rsyslog.com, now offers paid support.
Installing and configuring rsyslog is pretty simple. In the past when I’ve used rsyslog, I allowed the logs to “mix” so that the remote logs reside with the local logs. The combination of the number of remote nodes and the size of the logs was manageable. I liked mixing them because I could easily use grep to parse through the logs first. However, you do run the risk of these logs becoming very large. You might also want to keep the logs separate so you can more easily track down problems with a specific system.
syslog-ng
Much like rsyslog, syslog-ng is an implementation of the syslog protocol with extensions that incorporate flexible configuration options, filtering on the basis of content and other factors, and the addition of TCP for transport. Syslog-ng is still open source, but a company also sells a version that comes with additional plugins and features. Interestingly, it offers an appliance (hardware and software) with a web-based user interface that adds very fast text search, unifying search, and content-based alerting.
Installing syslog-ng is easy enough because it exists in many repositories for package managers. If you like, you can also build it from source, because sometimes these repositories use a fairly old version.
Configuring syslog-ng is a bit more involved than rsyslog in my opinion, but it’s still not difficult. A YouTube video offers help.
NXLog
The last tool that focuses on log gathering and management is NXLog. What makes it unique is support for Windows, macOS, and IBM AIX in addition to Linux. Of course, it has a client-server architecture, but it also offers log parsing, filtering, and conversion.
Interestingly, the project started as a closed pre-product, but after awhile, the NXLog source was made available. You can download the source code or pre-binaries, as well as installation and configuration documentation.
Log Browsing
Before the advent of fancy tools to collect and search logs for patterns, administrators just used text tools to parse through the collected logs looking for abnormalities. Administrators still do this today to look for obvious things, relying on the more sophisticated tools to spot subtle problems (e.g., everyday tools such as more, less, grep, sed, awk, sort, cut, head, tail, wc, cat, nl, diff, expand, unexpand, fold, paste, split, uniq, join, fmt, and others). You can also use your favorite editor, even programmatically.
Don’t forget that *nix is designed to take output from one command as input to another to create pipelines or workflows. Tools such as *nix pipes, redirects, and the tee command can all be used to create pipelines that do very sophisticated things.
Nonetheless, simply browsing logs can be very useful. A simple multitail, an open source ncurses-based utility that can display multiple logfiles to standard output in a single window or a single shell, shows the last few lines of logs, much like tail. However, multitail can also do color highlighting, filtering, and adding and deleting windows, which are all very useful for log browsing and monitoring. You can also merge output and show it in a single window.
A number of articles have instructions on installing and using multitail. Although I had never used the utility until I was writing this article, it looked interesting enough to include.
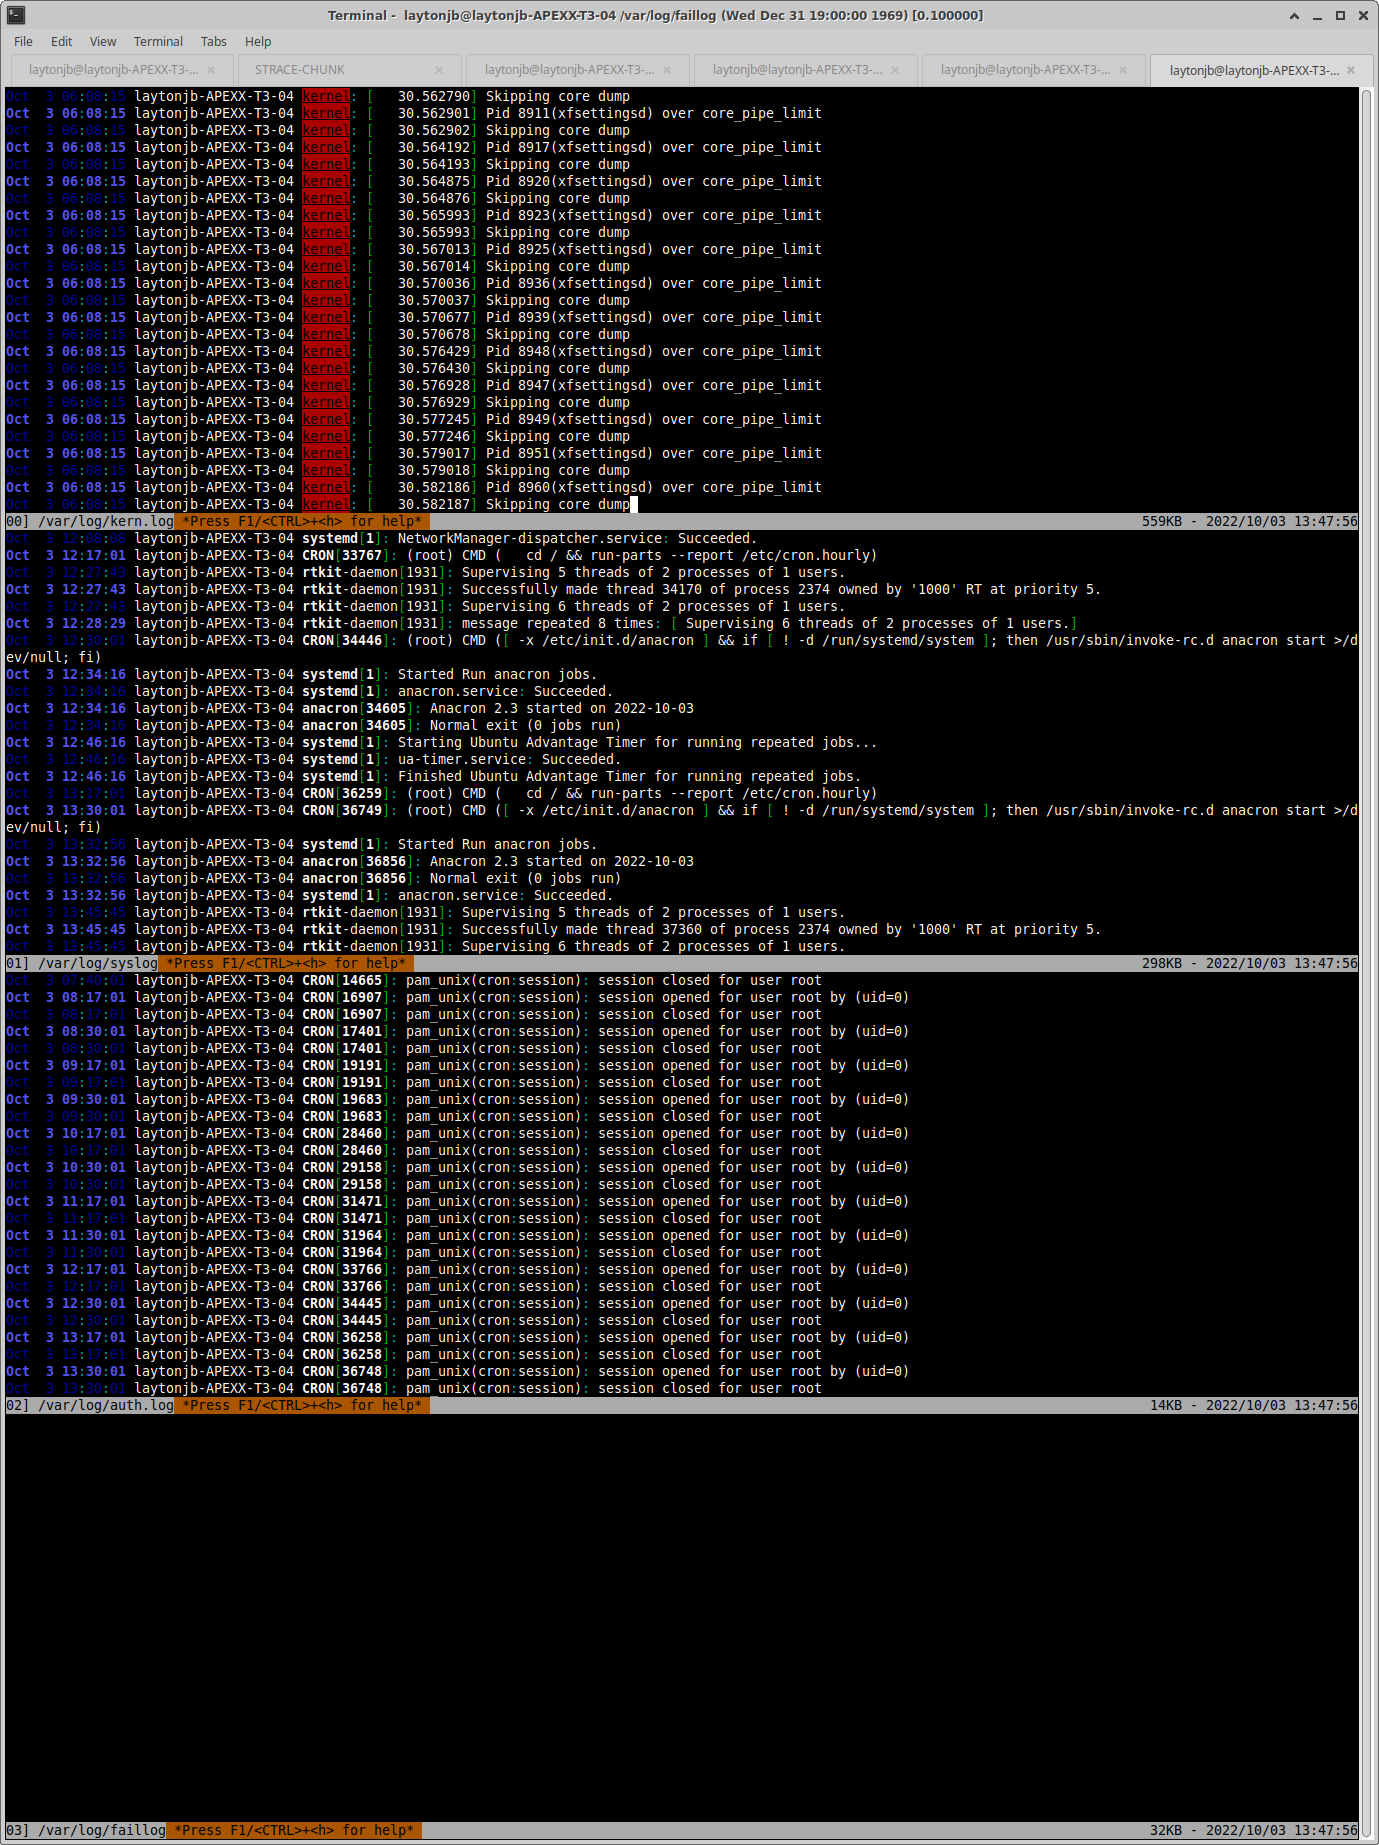
A quick test of multitail on my Ubuntu desktop
$ multitail /var/log/kern.log /var/log/syslog /var/log/auth.log /var/log/faillog
yielded the results in Figure 1.
Summary
System logs can be a very useful source of information for administrators, but looking through them every day on distributed systems that require a login is a pain. Collecting these logs into a single place is an important step in configuring HPC systems. This article is just a quick overview of a few options for collecting logs.
I personally use rsyslog on my systems (the open source variety). I’ve found it very simple to configure and use. Typically, I collect the logs on the head node (make sure it has enough space). Optionally, I collect them on a secondary server (e.g., a storage server). Fortunately, the logs on the HPC systems I’ve used don’t grow too quickly, so I’m not particularly worried about filling up my system. However large systems will confront this limitation, so you need to be sure you have a way to rotate logs.
If long-term retention of logs is important, be sure you make backups at regular intervals (perhaps when you rotate them).
As mentioned earlier, the next article will cover the fun stuff: log analysis. If you can’t call it fun, it is at least a very necessary aspect of administration that is often ignored.
This article originally appeared on the ADMIN Enterprise HPC website and is reprinted here with permission.
Want to read more? Check out the latest on ADMIN Enterprise HPC.
Ready to find a job?
Check out the latest job listings at Open Source JobHub.


Comments